
Monitor Your CPU Temperature in Real Time
Core Temp reads each processor core’s temperature directly from the Digital Thermal Sensors inside your CPU. Lightweight, accurate, and trusted by millions of PC users worldwide.
What Is Core Temp?
A compact CPU temperature monitor that reads directly from your processor’s built-in thermal sensors.
Direct sensor readings, no guesswork
Core Temp is a CPU temperature monitoring program for Windows that pulls temperature data straight from the Digital Thermal Sensors (DTS) inside Intel, AMD, and VIA processors. Most system monitors rely on motherboard sensors placed near the CPU socket. Core Temp bypasses those entirely and reads each core individually, which gives you more accurate numbers and faster response times when temperatures spike.
Per-core monitoring for modern CPUs
Modern processors pack a lot of cores, and they don’t all run at the same temperature. A Ryzen 9 might have 16 cores spread across two CCDs, each with its own thermal profile. Core Temp shows you the temperature for every single core, including separate P-core and E-core readings on Intel’s hybrid chips like the 13th and 14th Gen lineup. You can see at a glance which cores are running hot under load and which are idling cool.
Built for a specific job
Arthur Liberman at ALCPU has maintained Core Temp since the mid-2000s. The program sits at around 1.3 MB installed, runs from the system tray, and does one thing well: show you how hot your CPU is running. It supports overheat alerts, temperature logging, and a plugin system for extensions. There is also an Android companion app if you want to check temperatures remotely. Unlike broader tools such as HWiNFO or HWMonitor, Core Temp keeps its scope narrow on purpose. Version 1.19.5 added support for newer AMD Zen 5 and Intel Arrow Lake processors, plus effective clock frequency readouts.
The program is free for personal use. Commercial licenses start at $20 per machine, which is mostly relevant for IT departments monitoring server racks or workstation fleets. A standalone ZIP version is available if you prefer not to run the installer.
Ready to keep an eye on your CPU? Download Core Temp or read the setup guide.
Key Features of Core Temp
Built around Digital Thermal Sensor readings, Core Temp gives you direct access to the temperature data that matters most for your processor.
Per-Core DTS Temperature Readings
Core Temp pulls temperature data straight from the Digital Thermal Sensors embedded in each CPU core. This bypasses motherboard-level sensors entirely, giving you the most accurate readings possible. Each core gets its own real-time temperature display, so you can spot thermal differences between cores at a glance.
Intel P-Core & E-Core Labels
On Intel 12th-gen and newer hybrid processors, Core Temp marks each core as Performance (P) or Efficiency (E). You always know which cores are running hot and whether workloads are spread across both core types.
AMD Zen Per-CCD Temperatures
For AMD Ryzen and Threadripper chips based on Zen architecture, Core Temp reports individual CCD (Core Complex Die) temperatures. Multi-chiplet designs often run at different temps across dies, and this feature lets you track each one independently.
Overheat Protection Alerts
Set custom temperature thresholds that trigger popup notifications, audio alerts, or automatic system shutdown when temps climb too high. Useful for overclocked rigs or workstations running sustained loads where thermal runaway is a real concern.
System Tray Per-Core Display
Each CPU core gets its own system tray icon showing a live temperature number. No need to open the main window – glance at your taskbar and see every core’s current reading. The tray colors shift from green to yellow to red based on temperature ranges you define.
CPU Frequency, TDP & TjMax
Beyond temperature, Core Temp displays the current clock frequency for each core, the processor’s TDP (Thermal Design Power) rating, and TjMax – the maximum safe operating temperature set by the chip manufacturer. Effective clock speed is also shown for workload analysis.
Temperature Logging & History
Core Temp can write continuous temperature logs to a CSV file on disk. This is particularly helpful for diagnosing thermal issues over time – run a stress test or a rendering job, then review the log to see exactly when and where temperatures peaked. The log records timestamps, per-core temps, CPU load, and frequency data.
Plugin & Add-On Platform
A built-in plugin system lets third-party developers extend Core Temp’s functionality. Plugins exist for desktop widgets, remote monitoring, Rainmeter integration, and more. The SDK is publicly available for anyone who wants to build custom extensions.
Android Remote Monitoring
The Core Temp Monitor companion app for Android connects to your PC over your local network. Check your CPU temperatures from your phone while gaming, running benchmarks, or troubleshooting from another room without switching screens.
31 Language Translations
Core Temp ships with translations for 31 languages, contributed by its community. The interface adapts fully to your system locale, making it accessible to users worldwide without any extra configuration.
Tiny Footprint
The entire application weighs around 1.3 MB installed and uses minimal CPU and RAM while running. Unlike heavier monitoring suites such as HWiNFO or HWMonitor, Core Temp focuses strictly on CPU temperature without pulling in GPU, fan, or voltage sensors.
Wide Processor Compatibility
Supports Intel Core, Xeon, and Atom families, AMD Ryzen, FX, Athlon, and Threadripper lines, plus VIA C7 and Nano chips. Server processors including Xeon Scalable and EPYC are also covered, with updates for each new generation typically arriving within weeks of launch.
Ready to monitor your CPU temperatures? Download Core Temp and get started in under a minute.
System Requirements
Core Temp runs on nearly any Windows PC made in the last 15 years. Here is what your system needs.
| Component | Minimum | Recommended |
|---|---|---|
| Operating System | Windows XP SP3 (32-bit or 64-bit) | Windows 10 or 11 (64-bit) |
| Processor | Any x86 CPU with DTS (Intel Core, AMD Athlon 64+, VIA C7+) |
Intel Core 2nd Gen+ or AMD Zen+ for full feature support |
| RAM | 256 MB | 1 GB or more |
| Disk Space | 5 MB (standalone ZIP: 0.7 MB) | 10 MB (with plugins and logs) |
| Display | 800 × 600, 96 DPI | 1280 × 720 or higher |
| .NET Framework | Not required for core functionality | .NET Framework 2.0+ for certain plugins |
| Permissions | Administrator rights for driver install | Admin on first run; standard user after |
Download Core Temp
Get the latest version of Core Temp for your Windows PC. Pick the installer for a standard setup or grab the portable ZIP if you prefer no installation.
Core Temp Installer
Version 1.19.5 | 1.3 MB | Released October 19, 2025
Download Core TempWindows installer (.exe) — supports Windows 7 through Windows 11
Portable 64-bit
Download ZIP (64-bit)Portable 32-bit
Download ZIP (32-bit)
Core Temp is free for personal use. A commercial license costs $20-25 per machine.
The portable versions are great for USB drives or systems where you cannot install software. Uncheck bundled offers in the installer if prompted.
Getting Started with Core Temp
From download to your first temperature reading in under five minutes. Here is everything you need to know about setting up Core Temp on your Windows PC.
Downloading Core Temp
Head to our download section above to grab Core Temp v1.19.5. You have three options to pick from, depending on your preference:
- Installer (.exe) – ~1.3 MB: The standard setup file. Best for most users who want Core Temp installed properly in their Start Menu and Program Files folder. This is the option to choose if you plan to keep Core Temp running regularly.
- 64-bit Standalone (.zip) – ~0.7 MB: A portable version you can extract anywhere and run without installing. Great if you want to keep it on a USB drive or just test it quickly without committing to a full install. If you are running a 64-bit version of Windows (most modern PCs are), use this one.
- 32-bit Standalone (.zip) – ~0.7 MB: Same portable approach, but for older 32-bit Windows systems. You probably only need this if you are running an ancient XP or Vista machine.
The download should take just a few seconds – the entire installer is smaller than most photos on your phone. If your browser blocks the download or shows a warning, click “Keep” or “Allow” – it is a false positive from Windows SmartScreen because Core Temp is not signed with an EV code certificate.
If you want to skip the installer entirely and avoid any bundled offers, go with the standalone ZIP version. Extract it to a folder like C:ToolsCoreTemp and run Core Temp.exe directly.
Installation Walkthrough
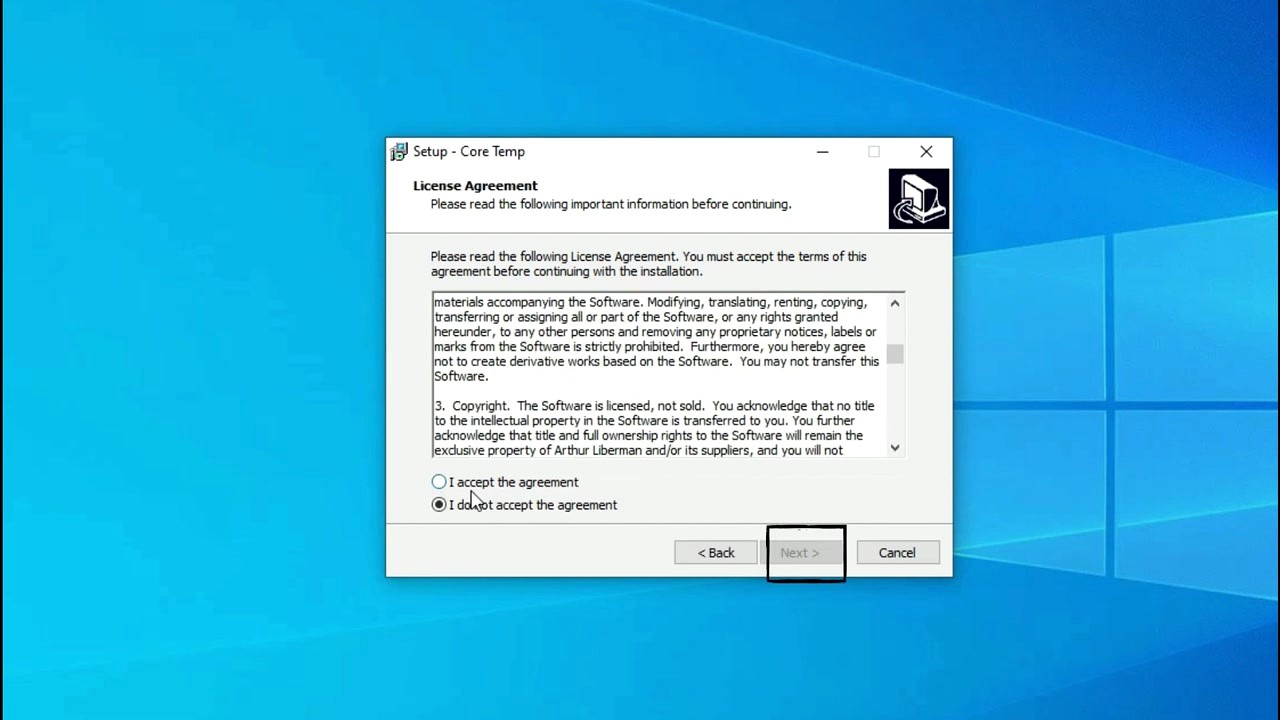
Double-click the downloaded Core-Temp-setup-v1.19.5.69.exe file. If Windows SmartScreen pops up with “Windows protected your PC,” click More info and then Run anyway. The publisher is listed as Arthur Liberman – that is the legitimate developer.
The installer walks you through five screens. Pay attention to each one:
- License Agreement: Select “I accept the agreement” and click Next. The license covers free personal use – commercial deployments require a separate license ($20-25 per machine).
- Select Destination: The default path is
C:Program FilesCore Temp. Leave this as-is unless you have a specific reason to change it. Click Next. - Additional Tasks: Here you can choose whether to create a desktop shortcut and a Start Menu entry. Both are checked by default and worth keeping.
- Bundled Software Offer: This is the screen that catches people off guard. You will see an offer to install a browser toolbar, game, or other third-party software. Uncheck everything on this page. Read the text carefully – sometimes the checkbox wording is reversed so “decline” actually means accepting. Click Next or Decline to skip it.
- Ready to Install: Review your choices and click Install. The process takes about two seconds.
Watch out for bundled offers. The Core Temp installer has historically included offers for third-party software like browser extensions or games. Always choose the custom/advanced install option and uncheck any extras. The standalone ZIP avoids this entirely.
After installation finishes, the installer will ask if you want to launch Core Temp right away. Leave the checkbox ticked and click Finish. Core Temp does not require a restart or any registration – it opens immediately and starts reading your CPU temperatures.
Core Temp is a Windows-only application. It supports every version from Windows XP through Windows 11, including Server editions (2008 through 2025). There is no macOS or Linux version, though the developer provides an Android companion app called Core Temp Monitor for remote viewing.
Initial Setup and Configuration
When Core Temp launches for the first time, it immediately detects your CPU and starts showing per-core temperatures. There is no wizard or setup screen to wade through. But a few settings are worth adjusting before you do anything else.
Go to Options > Settings to open the configuration panel. Here are the tabs that matter most:
- General tab: Enable “Start Core Temp with Windows” if you want temperature monitoring every time your PC boots. Also check “Start Core Temp minimized” so it goes straight to the system tray without cluttering your desktop.
- Display tab: Under “System Tray,” set the tray icon mode to “All cores” to show a separate temperature reading for each core in your taskbar notification area. You can also pick between Celsius and Fahrenheit here.
- Notification Area tab: Choose the font size and colors for your tray icons. A font size of 7 works well for most displays. You can color-code temperature ranges – for example, green below 60°C, yellow from 60-80°C, and red above 80°C.
Under Options > Settings > General, enable “Close to Notification Area”. Without this, clicking the X button shuts down Core Temp completely instead of minimizing it to the tray. Most people want it running quietly in the background.
If you are coming from HWMonitor or Open Hardware Monitor, note that Core Temp focuses exclusively on CPU temperatures from the Digital Thermal Sensors. It does not show GPU temps, fan speeds, or voltages – that is by design. The tradeoff is accuracy: Core Temp reads directly from the DTS instead of relying on motherboard sensor data, which can be less precise.
Your First Temperature Reading
With Core Temp running, you will see a compact window that packs a lot of information into a small space. Let’s walk through what each section means, top to bottom.
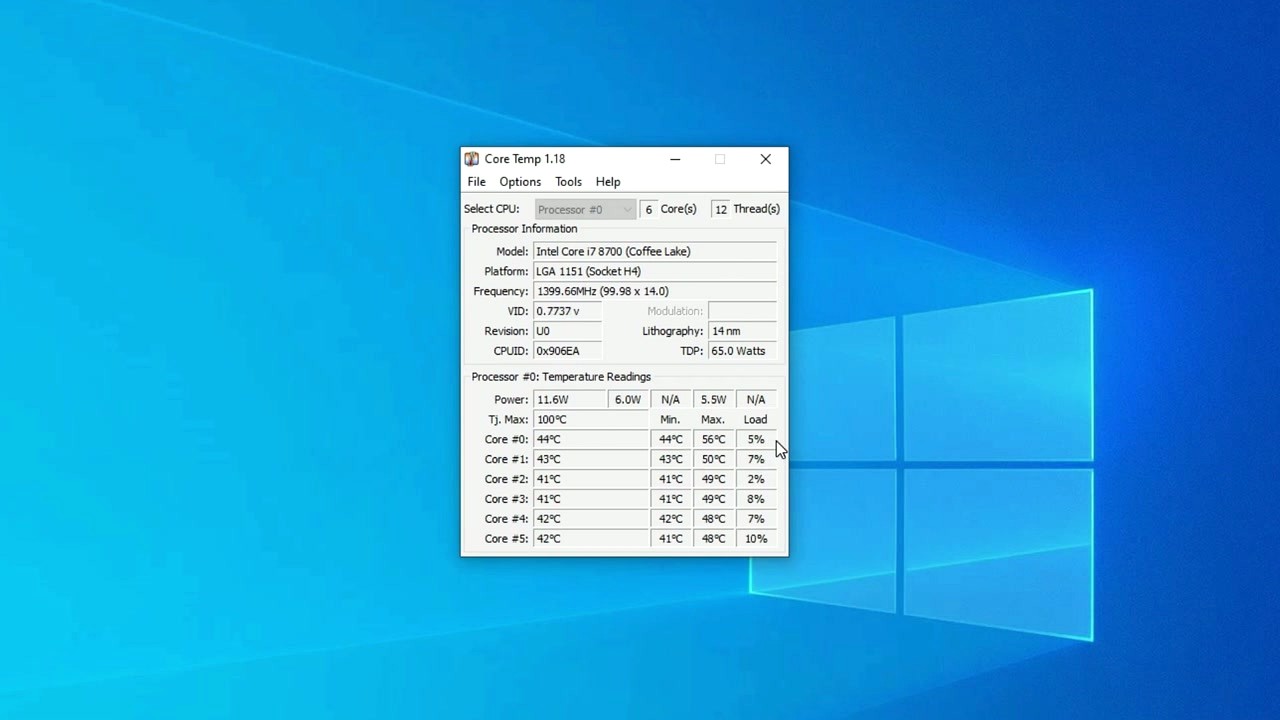
At the top, Processor Information shows your CPU model (e.g., “Intel Core i7-13700K”), the socket type, current frequency, VID voltage, lithography, and TDP. The Select CPU dropdown lets you switch between processors if your system has more than one.
Below that is the Temperature Readings table – the main reason you are here. Each row represents one CPU core, with four columns:
- Temperature (current): The live reading right now. On Intel hybrid CPUs (12th gen and newer), you will see P-core and E-core labels.
- Min: The lowest temperature recorded since Core Temp started. Useful to see your idle baseline.
- Max: The highest temperature recorded. This is what you want to watch during stress tests or heavy gaming sessions.
- Load: The current utilization percentage for that specific core.
The Tj. Max value at the top of the readings section is your CPU’s thermal throttling limit – typically 100°C for modern Intel chips and 95°C for AMD Ryzen. If any core hits this temperature, the CPU will slow itself down to prevent damage. You want your max temperatures to stay at least 10-15°C below Tj. Max during normal workloads.
Try opening a few programs or running a quick task to see the temperatures respond in real time. Idle temps between 30-50°C are normal. Under moderate load (web browsing, office work), 50-70°C is typical. During gaming or heavy rendering, 70-85°C is acceptable for most CPUs.
To reset the Min and Max columns back to current values, go to Options > Clear Min/Max (or press F5). This is useful when you want to start a fresh monitoring session before a benchmark or game.
Tips, Tricks and Best Practices
Set up overheat protection. Go to Options > Overheat Protection. You can have Core Temp trigger an action (play a sound, shut down the PC, or run a custom program) when temperatures exceed a threshold you choose. Set this to about 5°C below your Tj. Max for a safety buffer.
Enable temperature logging. Under Tools > Logging, you can toggle on CSV logging to record temperature data over time. The log file saves to your Core Temp folder and is useful for diagnosing intermittent overheating that you might not catch while staring at the screen.
Try the system tray view. Minimize Core Temp and check your notification area. Each core gets its own tray icon showing the live temperature. If you only see one icon, right-click the tray, go to “Taskbar settings,” and make sure Core Temp icons are set to “Show” instead of hidden in the overflow area.
Common mistakes beginners make: Panicking over Tj. Max being listed as 100°C (it is normal for modern CPUs), confusing the Max column with current temps, or thinking 80°C under full load means something is wrong. It usually doesn’t – check your cooler is seated properly if temps exceed 90°C at idle, though.
Features most people overlook: Core Temp has a plugin system under Tools > Add Ons that lets you add a Windows desktop gadget, Rainmeter integration, or even a remote web server to check temps from your phone. The Core Temp Grapher add-on creates a live graph of temperatures over time, which is more visual than the default table view.
| Shortcut | Action |
|---|---|
| F5 | Clear Min/Max temperature values |
| F6 | Toggle temperature logging on/off |
| F7 | Show/hide the system tray icons |
Where to find help: The ALCPU Support Forum is the official place to report bugs or ask questions – the developer Arthur Liberman responds personally. You will also find plenty of discussions in r/buildapc and r/overclocking on Reddit. Core Temp updates are released a few times per year through the official website – there is no built-in auto-update, so check the download section periodically for new versions.
Ready to start monitoring your CPU temperatures? Grab Core Temp from our download section and follow the steps above.
Frequently Asked Questions
Answers to the most common questions about downloading, installing, and using Core Temp on your Windows PC.
Is Core Temp safe to download and install?
Yes, Core Temp is safe when you download it from the official ALCPU website (alcpu.com/CoreTemp). The program has been around since 2009 and is developed by Arthur Liberman. Millions of users run it daily without issues.
That said, the installer version has drawn complaints on Reddit and tech forums because it bundles optional third-party software offers during setup. These are not viruses or malware — they are advertising deals that fund the free version. The standalone ZIP files (CoreTemp32.zip and CoreTemp64.zip) skip the installer entirely and contain just the program itself, with no bundled offers at all.
- Download from the official source at alcpu.com/CoreTemp or from our download section
- Choose the standalone ZIP version (about 0.7 MB) to avoid any bundled offers
- If you use the installer (~1.3 MB), read each screen carefully and uncheck any optional software
- Windows SmartScreen may show a warning because the installer is not code-signed by a large publisher — click “More info” then “Run anyway”
Pro tip: The standalone 64-bit ZIP (CoreTemp64.zip) is the cleanest option. Extract it to a folder like C:ToolsCoreTemp and run Core Temp.exe directly. No installation needed, nothing touches your registry.
For a full walkthrough of the safe installation process, see our Getting Started guide.
Is Core Temp a virus or does it contain malware?
No, Core Temp is not a virus. It is a legitimate CPU temperature monitoring utility that reads data from your processor’s built-in Digital Thermal Sensors (DTS). The confusion comes from two things: the bundled software offers in the installer, and Windows SmartScreen flagging the executable.
Multiple Reddit threads (r/pcmasterrace, r/techsupport, r/antivirus) discuss this. The consensus is the same every time: Core Temp itself is clean, but some users accidentally installed bundled adware like “Goodgame Empire” or “SearchProtect” by clicking through the installer too fast. These are advertising bundles, not malware baked into Core Temp. If you downloaded from a third-party site instead of alcpu.com, you may have gotten a repackaged version with actual malware — always use the official source.
- Core Temp reads CPU temperature sensors using documented Intel and AMD interfaces — it does not access your files, browser, or network
- The program runs as a standard user-mode application (no kernel driver required on Windows 10/11)
- VirusTotal scans of the official download consistently show 0/70+ detections
- The standalone ZIP version has zero additional software bundled
Pro tip: If you already installed Core Temp with the bundled software, just uninstall the unwanted programs through Windows Settings > Apps. Core Temp itself can stay. Going forward, grab the standalone ZIP from our download section instead.
Check our Features section to see what Core Temp actually monitors on your system.
Where is the official safe download for Core Temp?
The official download page is at alcpu.com/CoreTemp, maintained by the developer Arthur Liberman. This is the only source that guarantees you get the authentic, unmodified files.
Version 1.19.5 (released October 19, 2025) is the latest stable release. The official site offers three download options: the installer EXE (~1.3 MB), a 32-bit standalone ZIP (~0.7 MB), and a 64-bit standalone ZIP (~0.7 MB). Third-party download sites like Softpedia, FileHippo, and CNET also host Core Temp, but these sometimes wrap the download in their own installers with additional bundled software. Stick to the official site or our curated download links.
- Visit the official ALCPU website or our download section
- Pick the 64-bit standalone ZIP if you run Windows 10 or 11 (nearly all modern PCs are 64-bit)
- Pick the 32-bit standalone ZIP only if you run Windows XP, Vista, or a 32-bit Windows 7 install
- Use the installer EXE only if you want Start Menu shortcuts and auto-start with Windows
Pro tip: Bookmark the ALCPU forum page (alcpu.com/forums) too. That is where the developer posts changelogs and responds to bug reports directly.
See our Getting Started guide for step-by-step download and setup instructions.
Does Core Temp work on Windows 11?
Yes, Core Temp works on Windows 11 without any issues. Version 1.19.5 fully supports Windows 11 (including 23H2 and 24H2 builds) and correctly identifies Intel 12th, 13th, and 14th Gen hybrid architectures with separate P-core and E-core temperature readings.
Core Temp supports every Windows version from XP through Windows 11, plus Windows Server 2008 through 2025. On Windows 11, it reads temperatures from the DTS sensors inside Intel Alder Lake, Raptor Lake, and Meteor Lake CPUs, as well as AMD Ryzen 7000 and 9000 series processors based on Zen 4 and Zen 5. The system tray integration works normally, showing per-core temperatures in the taskbar notification area.
- Windows 11 Home, Pro, and Enterprise editions are all supported
- Both 64-bit and ARM64 (Windows on ARM) versions of Windows 11 are compatible
- Intel hybrid CPUs correctly show “(P)” and “(E)” labels next to each core
- AMD Zen 4/5 processors display per-CCD temperature readings
- No administrator privileges required for basic temperature monitoring
Pro tip: On Windows 11 with an Intel 12th Gen or newer CPU, enable “Show all cores” in Options > Settings to see both Performance and Efficiency cores separately. The E-cores typically run 10-15°C cooler than P-cores under load.
Check the System Requirements for full compatibility details.
Does Core Temp work with AMD Ryzen processors?
Yes. Core Temp fully supports AMD Ryzen processors from every generation: Ryzen 1000 (Zen 1) through Ryzen 9000 (Zen 5), including Threadripper and EPYC server chips.
For AMD Zen-based CPUs, Core Temp reads temperatures from the on-die thermal sensors and also provides per-CCD (Core Complex Die) temperature data, which is useful for multi-chiplet designs like the Ryzen 9 7950X or Threadripper PRO 7995WX. Older AMD chips (FX-series, Athlon, Phenom) are supported too, though those report a single package temperature rather than per-core readings. VIA C7 and Nano processors are also supported, though those are rare in 2025.
- Ryzen 3, 5, 7, 9 (desktop and mobile) — all generations supported
- Threadripper and Threadripper PRO — per-CCD readings available
- EPYC server processors — supported on Windows Server
- Older AMD FX, Athlon, Phenom — package temperature only
- AMD APUs (Ryzen with Radeon graphics) — CPU temperature readings work, GPU temperature requires a separate tool
Pro tip: If Core Temp shows “Tdie” and “Tctl” for your Ryzen chip, pay attention to Tdie. Tctl includes an offset (usually +10°C on first-gen Ryzen) used for fan curve scaling, so it reads higher than the actual junction temperature.
See the full list of supported hardware in our Features section.
Does Core Temp support 32-bit operating systems?
Yes. Core Temp provides a dedicated 32-bit build (CoreTemp32.zip, about 0.7 MB) that runs on 32-bit versions of Windows XP, Vista, 7, 8, and 8.1. The installer EXE also supports 32-bit systems.
On 32-bit Windows, Core Temp works identically to the 64-bit version for temperature monitoring. It reads the same DTS sensor data and shows per-core temperatures, CPU load, frequency, and TjMax. The only limitation is that 32-bit Windows itself caps at 4 GB of addressable RAM, which is not a Core Temp issue but a system-level constraint. If you are running an older machine with a 32-bit OS, Core Temp is one of the few monitoring tools that still provides a maintained 32-bit binary.
- Download CoreTemp32.zip from the official site or our download section
- Extract to any folder and run Core Temp.exe — no installer required
- Works on Windows XP SP3 and later
Pro tip: If you are unsure whether your Windows is 32-bit or 64-bit, press Windows+Pause/Break to open System Properties. Under “System type” it will say either “32-bit Operating System” or “64-bit Operating System.”
Review the System Requirements for the minimum hardware specs.
Is Core Temp completely free to use?
Core Temp is free for personal and non-commercial use. If you are monitoring your home PC, gaming rig, or personal laptop, you pay nothing.
Commercial use (businesses, IT departments, enterprises) requires a paid license at $20-25 per machine, depending on volume. This applies to companies deploying Core Temp across office workstations or using it for server monitoring in a data center. The commercial license removes the startup nag screen and includes priority support from the developer. Schools and non-profits should contact ALCPU directly for educational pricing.
- Personal use on your own computers: free, no registration needed
- Commercial deployment at a business: $20-25 per machine (bulk discounts available)
- The free version has no feature restrictions — temperature monitoring, logging, overheat protection, and plugins all work the same
- There is no “premium” tier with extra features locked behind a paywall
Pro tip: If you work in IT and need to deploy Core Temp across many machines, the standalone ZIP version is easiest to distribute. Drop it in a shared network folder and let users run it directly. No installation needed, no admin rights required.
Download the free version from our download section.
What is the difference between Core Temp free and the commercial license?
There is no feature difference. The free version and the commercial license give you the same program with the same capabilities. The license is about usage rights, not functionality.
The free version is licensed for personal, non-commercial use. If you use Core Temp at home, on your own machines, you never need to pay. The commercial license ($20-25 per machine) grants legal permission to run Core Temp in business environments. It also removes a brief nag dialog that appears on startup in the free version and provides direct email support from the developer Arthur Liberman.
- Free: all features, personal use, startup nag dialog
- Commercial: all features, business use, no nag dialog, priority email support
- Both versions receive the same updates at the same time
- No “Pro” or “Premium” edition with extra monitoring features
Pro tip: For home users wondering if they are “missing out” on paid features: you are not. Every monitoring capability, plugin, log function, and overheat alert works in the free version.
Learn more about what Core Temp can do in the Features section.
How do I download and install Core Temp step by step?
Download Core Temp from our download section or the official site at alcpu.com/CoreTemp. The whole process takes under two minutes.
You have two options: the installer EXE (~1.3 MB) or the standalone ZIP (~0.7 MB). The installer adds Start Menu entries and can set Core Temp to launch on Windows startup. The standalone ZIP is a portable version that runs from any folder without modifying your system.
- Go to our download section and click the download button for your preferred version
- For the installer: Run Core-Temp-setup-v1.19.5.69.exe. On the first screen, accept the license agreement. On the second screen, uncheck any optional software offers. Choose your install folder (default is fine). Click Install.
- For the standalone ZIP: Extract CoreTemp64.zip to a folder like C:ToolsCoreTemp. Double-click Core Temp.exe to run.
- If Windows SmartScreen pops up, click “More info” then “Run anyway” — this appears because the EXE is not signed by a major publisher
- Core Temp opens and immediately shows your CPU model, per-core temperatures, frequency, and load
Pro tip: After first launch, go to Options > Settings > General and check “Start Core Temp with Windows” if you want temperature readings available every time you boot up. Also enable “Start Core Temp minimized” so it goes straight to the system tray.
For more detailed setup instructions, read our Getting Started guide.
Core Temp portable vs installer — which should I choose?
For most people, the portable standalone ZIP is the better choice. It is smaller (~0.7 MB vs ~1.3 MB), has no bundled software offers, and runs without installation.
The installer makes sense if you want Core Temp to appear in your Start Menu and automatically launch when Windows boots. It also registers the program in Add/Remove Programs for clean uninstallation. The downside is that the installer has historically included optional third-party software offers (advertising deals) that you need to decline during setup. Many Reddit users specifically recommend the standalone version for this reason.
- Portable (ZIP): No install, no bundled offers, runs from any folder, easy to move between PCs on a USB drive. You manually set up auto-start if you want it.
- Installer (EXE): Start Menu shortcut, optional auto-start with Windows, shows in Add/Remove Programs. Watch for optional software offers during setup.
- Both versions have identical features and update to the same version
- The portable version stores its settings in a .ini file next to the executable, so your config travels with the program
Pro tip: You can make the portable version auto-start by creating a shortcut to Core Temp.exe in your Windows Startup folder. Press Win+R, type “shell:startup”, and drop the shortcut there.
Download either version from our download section.
How to fix Core Temp installation errors on Windows?
Most Core Temp installation errors come from Windows SmartScreen blocking the file, antivirus quarantining the EXE, or insufficient permissions. These are all fixable in a few steps.
Since Core Temp is a small utility by an independent developer, it does not carry the expensive code-signing certificates that major publishers use. Windows SmartScreen and some antivirus products treat unsigned executables with extra suspicion, even when the file is clean. This is the most common cause of “installation blocked” errors on Windows 10 and 11.
- SmartScreen block: Click “More info” on the blue warning dialog, then click “Run anyway”
- Antivirus quarantine: Add an exclusion for the Core Temp folder in your antivirus settings (Windows Defender: Settings > Virus & threat protection > Exclusions)
- Permission denied: Right-click the installer, select “Run as administrator”
- Corrupted download: Delete the file and re-download. The installer should be about 1.3 MB; anything much smaller is likely incomplete
- Still failing: Skip the installer entirely and use the standalone ZIP version — it does not require installation at all
Pro tip: If you run into repeated problems with the installer on a work computer (corporate antivirus, group policy restrictions), the standalone ZIP is almost always the solution. It does not trigger installer-based security policies because there is no installer to run.
For full installation steps, see our Getting Started guide.
How to fix Core Temp not opening or crashing on launch?
If Core Temp closes immediately or crashes on launch, the usual cause is a conflict with another hardware monitoring tool, a corrupted config file, or a driver-level issue. Here is how to fix it.
Core Temp accesses low-level CPU registers to read temperature data. If another monitoring program (HWMonitor, HWiNFO, AIDA64, or a motherboard vendor utility like MSI Afterburner or ASUS AI Suite) is already reading those registers, you can get a conflict that causes one or both programs to crash. This is especially common on systems where the motherboard vendor’s monitoring software runs at startup.
- Close all other hardware monitoring tools before launching Core Temp
- Delete the Core Temp configuration file (Core Temp.ini in the same folder as the executable) to reset all settings to defaults
- Run Core Temp as administrator: right-click > “Run as administrator”
- Disable your motherboard vendor’s monitoring software (ASUS AI Suite, MSI Dragon Center, Gigabyte SIV, etc.) from starting with Windows
- Try the opposite version: if you use the 64-bit build, try the 32-bit build, and vice versa
Pro tip: If Core Temp opens but shows 0°C or no temperature data, your CPU might not be in the supported processor list yet. Check alcpu.com/forums for the latest beta builds — the developer frequently adds support for newly released CPUs before the stable release.
See our Features section for supported processor families.
Core Temp shows wrong or inaccurate temperature readings — how to fix?
If Core Temp shows unusually high, low, or mismatched temperature readings, the issue is almost always related to TjMax calibration, a conflict with another monitoring tool, or the specific sensor behavior of your CPU.
Core Temp calculates temperature as: Temperature = TjMax – DTS value. TjMax is the maximum junction temperature for your specific CPU (typically 100°C for modern Intel, 95°C for many AMD Ryzen chips). If Core Temp has the wrong TjMax value for your processor, all readings will be off by that difference. Tom’s Hardware forum threads frequently discuss discrepancies between HWMonitor, Core Temp, and BIOS readings — these usually come down to different tools using different TjMax assumptions.
- Go to Options > Settings > Advanced > Temperature and check the TjMax value. Compare it with your CPU’s official datasheet
- Close other monitoring tools (HWMonitor, HWiNFO, AIDA64) and relaunch Core Temp alone to rule out conflicts
- Update to the latest version (1.19.5) — older versions may have incorrect TjMax values for newer CPUs
- Cross-check with your BIOS temperature reading at idle to establish a baseline
- For AMD Ryzen: look at the “Tdie” value, not “Tctl” — Tctl includes a platform-specific offset for fan curve control
Pro tip: First-gen Ryzen processors (1000-series) add a +10°C offset to Tctl. If Core Temp shows 50°C idle on a Ryzen 1700, the real junction temperature is closer to 40°C. Later Ryzen generations removed this offset.
Check the System Requirements for your CPU’s compatibility details.
Core Temp not showing all cores — how to fix?
If Core Temp shows fewer cores than your CPU actually has, the most likely causes are a display setting, a BIOS configuration that disables cores, or a very new CPU that needs an updated version of Core Temp.
Intel 12th Gen and newer CPUs have two types of cores (Performance and Efficiency). Core Temp version 1.18 and later displays both with “(P)” and “(E)” labels. Older versions may only show the P-cores. On AMD Ryzen multi-chiplet processors (like the 7950X with two CCDs), all cores should appear, but they are grouped by CCD.
- Update to Core Temp 1.19.5 or later — older versions may not recognize all cores on hybrid CPUs
- Check Options > Settings > Display and make sure “Show all cores” is enabled
- Check your BIOS settings — some motherboards allow disabling individual cores or CCDs for overclocking purposes
- If you have an Intel CPU with Hyper-Threading disabled in BIOS, Core Temp shows physical cores only (which is correct)
- For brand-new CPUs (within the first few weeks of launch), check the ALCPU forums for a beta build with updated processor support
Pro tip: The “Show highest temperature of each core” option in Settings > Notification Area reduces tray clutter on CPUs with many cores. For an Intel i9-13900K (24 cores), showing all cores in the tray takes up a lot of space. Use this option to show just the hottest core instead.
For setup help, see our Getting Started guide.
How do I update Core Temp to the latest version?
Core Temp does not have a built-in auto-update mechanism. To update, download the latest version and replace the old files.
The current version is 1.19.5, released October 19, 2025. Updates are infrequent (typically 2-3 per year) and usually add support for newly released Intel and AMD processors. You can check your current version by opening Core Temp and looking at the title bar, or going to Help > About.
- Close Core Temp if it is running (right-click the tray icon > Exit)
- Download the latest version from our download section or alcpu.com/CoreTemp
- Standalone users: Extract the new ZIP over your existing folder, replacing all files. Your settings in Core Temp.ini are preserved.
- Installer users: Run the new installer. It will upgrade the existing installation in place.
- Relaunch Core Temp and verify the version in the title bar
Pro tip: Subscribe to the ALCPU forums (alcpu.com/forums) release announcements to know when new versions drop. Updates typically come right after Intel or AMD launches a new processor generation, adding detection and correct TjMax values for those chips.
Check the download section for the latest available version.
What is new in the latest version of Core Temp?
Core Temp 1.19.5 (released October 2025) added support for the latest Intel and AMD processor families, along with various bug fixes and interface improvements.
The 1.19.x series introduced several notable changes compared to earlier 1.18 builds: improved detection of Intel 14th Gen (Raptor Lake Refresh) CPUs, support for AMD Zen 5 (Ryzen 9000 series), correct per-CCD temperature reporting for AMD multi-chiplet designs, and better handling of Intel hybrid architectures where P-core and E-core temperatures need separate tracking. The dark mode support was also refined in this release cycle.
- Intel Meteor Lake and Arrow Lake mobile CPU support added
- AMD Ryzen 9000-series (Zen 5) detection and correct TjMax values
- Improved P-core/E-core labeling for Intel Alder Lake, Raptor Lake, and Meteor Lake
- Per-CCD temperature readout improvements for AMD Threadripper PRO
- Dark mode UI refinements and bug fixes
- Effective clock frequency display accuracy improved
Pro tip: If you have a very new CPU and Core Temp shows “Unknown CPU” or incorrect data, check the ALCPU forums for a release candidate (RC) build. Arthur Liberman often posts pre-release builds with support for brand-new hardware weeks before the stable release.
Download the latest version from our download section.
Core Temp vs HWMonitor — which is better for CPU temperature?
Core Temp is better if you only care about CPU temperature and want something lightweight. HWMonitor is better if you want a single window that also shows GPU temp, fan speeds, voltages, and other hardware sensors.
Core Temp focuses exclusively on CPU monitoring. It reads temperatures from the DTS sensors inside Intel and AMD processors with per-core granularity, shows TjMax distance, effective clock speed, and TDP. The program uses about 5-10 MB of RAM and has minimal CPU overhead. HWMonitor, developed by CPUID, monitors the entire system: CPU, GPU, motherboard, drives, PSU voltages, fan RPMs. It pulls data from multiple sensor interfaces (not just DTS). The tradeoff is that HWMonitor is a bigger program with more data to parse, and it has been called out on overclocking forums (Tom’s Hardware, Reddit r/overclocking) for sometimes showing inconsistent temperature values compared to HWiNFO.
- Core Temp: CPU-only, tiny footprint (~5 MB RAM), per-core DTS readings, system tray icons per core, overheat protection alerts, plugin support, free for personal use
- HWMonitor: Full system monitoring (CPU + GPU + fans + voltages + drives), larger interface, no overheat alerting in free version, free and paid ($25) versions
- Accuracy: Both read from the same DTS sensors for CPU temp, so readings should match. Discrepancies usually come from different TjMax assumptions
- Bottom line: Use Core Temp for focused CPU monitoring with alerting. Use HWMonitor if you want everything in one place and do not need alerts
Pro tip: Many experienced builders run Core Temp for always-on tray monitoring and HWiNFO for deep diagnostic sessions. The two serve different purposes well.
See what makes Core Temp stand out in our Features section.
Core Temp vs HWiNFO — which should I use?
HWiNFO is the more comprehensive tool. Core Temp is simpler and more focused. Your choice depends on how deep you want to go.
HWiNFO64 is the go-to recommendation on Reddit’s r/overclocking and r/buildapc for detailed hardware analysis. It monitors every sensor on your system (CPU, GPU, chipset, NVMe drives, memory controllers, VRM temperatures) and provides min/max/average values with data logging. Its sensor readout window can be overwhelming for someone who just wants to know “is my CPU too hot?” Core Temp answers that one question well, without the complexity.
- Core Temp: Opens in 1 second, shows CPU temps immediately, clean tray icons, ~0.7 MB download, great for daily monitoring
- HWiNFO: Takes a few seconds to initialize all sensors, shows hundreds of data points, ~8 MB download, great for diagnostics and overclocking
- Accuracy: HWiNFO is widely considered the most accurate on overclocking forums because it exposes raw sensor values with the least processing
- Integration: HWiNFO works with Rainmeter, RTSS (RivaTuner), and game overlays for real-time monitoring in games. Core Temp has its own plugin system and a dedicated Android companion app
Pro tip: If you just built a PC and want a quick sanity check on CPU temps, grab Core Temp. If you are overclocking, stress testing, or troubleshooting instability, use HWiNFO for the extra sensor detail.
Download Core Temp from our download section to get started.
How do I set up Core Temp overheat protection alerts?
Core Temp can automatically warn you or even shut down your PC when CPU temperature exceeds a threshold. This is configured in Options > Overheat Protection.
Overheat protection is one of Core Temp’s most practical features, especially for systems with aggressive overclocks or inadequate cooling. You can set two independent thresholds: a warning temperature (plays a sound, shows a popup, or flashes the tray icon) and a critical temperature (triggers a system shutdown, sleep, or hibernate). These thresholds apply per-core, meaning any single core hitting the limit will trigger the alert.
- Open Core Temp and go to Options > Overheat Protection
- Check “Enable overheat protection”
- Set the warning threshold (a good starting point: 85°C for Intel, 80°C for AMD Ryzen desktop chips)
- Set the critical action threshold (90-95°C for most CPUs) and choose the action: Shutdown, Sleep, Hibernate, or Run a custom program
- Optionally enable a warning sound or system tray flash for the warning threshold
- Click OK to save
Pro tip: For the “Run a program” action, you can point Core Temp at a batch script that sends you an email or Slack notification. Useful for unattended renders or server rooms where nobody is watching the screen. Set the threshold 5°C below TjMax (shown in the main Core Temp window) to give yourself a safety margin.
Learn more about Core Temp’s monitoring capabilities in our Features section.
How to enable Core Temp dark mode?
Core Temp includes a dark mode option. Go to Options > Settings > Display and check “Use dark mode” to switch the interface to a dark color scheme.
Dark mode was added in the Core Temp 1.18 release cycle. It changes the main window, tray tooltips, and settings dialogs to a dark background with light text. The feature follows your Windows system theme by default on Windows 10 and 11 — if you have Windows dark mode enabled, Core Temp will usually pick it up automatically. You can also force it on or off regardless of the system theme.
- Go to Options > Settings > Display tab
- Check or uncheck “Use dark mode”
- The change applies immediately, no restart required
- System tray icon colors remain the same in both modes for readability
Pro tip: If you find the system tray temperature text hard to read against your taskbar color (especially with dark mode enabled in Windows), go to Options > Settings > Notification Area and customize the font color and background for each core’s tray icon separately.
See all of Core Temp’s interface options in the Features section.
How to check CPU temperature with Core Temp while gaming?
The simplest way is to use Core Temp’s system tray icons. Each CPU core gets its own tray icon showing the current temperature. Glance at the taskbar while gaming, or hover over the icons for a tooltip with detailed info.
Core Temp runs in the background with very low overhead (under 1% CPU usage and about 5-10 MB RAM), so it will not affect your gaming performance. For a more visible option, Core Temp has plugins that can display temperatures in a desktop gadget or even in the Windows taskbar. There is also a Core Temp Remote Server feature that lets you monitor your PC’s temps from your phone using the Core Temp Monitor Android app while you are gaming in fullscreen.
- System tray method: Just run Core Temp minimized. Temperature icons appear next to the clock. Hover for full details.
- Android companion app: Install “Core Temp Monitor” on your phone. Enable the Remote Server in Core Temp (Options > Settings > Remote Server). Your phone shows real-time temps over your local network.
- MSI Afterburner integration: MSI Afterburner can read Core Temp data through its plugin system and overlay CPU temps on your game screen via RivaTuner Statistics Server (RTSS).
- Temperature logging: Enable logging in Options > Settings > Logging. After your gaming session, open the CSV log to see peak temps and identify thermal spikes.
Pro tip: For competitive gaming where you want minimal distractions, enable temperature logging and review the log file afterward instead of watching numbers mid-game. The log shows timestamps so you can correlate thermal spikes with specific in-game moments.
For setup instructions, see our Getting Started guide.
Still have questions? Visit the ALCPU Community Forums for developer support, or download Core Temp to try it yourself.